| Previous | Next |
Solaris Virtualization Product Overview
1. Introduction to Solaris Resource Management
2. Projects and Tasks (Overview)
3. Administering Projects and Tasks
4. Extended Accounting (Overview)
5. Administering Extended Accounting (Tasks)
6. Resource Controls (Overview)
7. Administering Resource Controls (Tasks)
8. Fair Share Scheduler (Overview)
9. Administering the Fair Share Scheduler (Tasks)
10. Physical Memory Control Using the Resource Capping Daemon (Overview)
11. Administering the Resource Capping Daemon (Tasks)
13. Creating and Administering Resource Pools (Tasks)
14. Resource Management Configuration Example
15. Resource Control Functionality in the Solaris Management Console
How to Access the Resource Controls Tab
16. Introduction to Solaris Zones
17. Non-Global Zone Configuration (Overview)
18. Planning and Configuring Non-Global Zones (Tasks)
19. About Installing, Halting, Cloning, and Uninstalling Non-Global Zones (Overview)
20. Installing, Booting, Halting, Uninstalling, and Cloning Non-Global Zones (Tasks)
21. Non-Global Zone Login (Overview)
22. Logging In to Non-Global Zones (Tasks)
23. Moving and Migrating Non-Global Zones (Tasks)
24. About Packages and Patches on a Solaris System With Zones Installed (Overview)
25. Adding and Removing Packages and Patches on a Solaris System With Zones Installed (Tasks)
26. Solaris Zones Administration (Overview)
27. Administering Solaris Zones (Tasks)
28. Troubleshooting Miscellaneous Solaris Zones Problems
29. About Branded Zones and the Linux Branded Zone
30. Planning the lx Branded Zone Configuration (Overview)
31. Configuring the lx Branded Zone (Tasks)
32. About Installing, Booting, Halting, Cloning, and Uninstalling lx Branded Zones (Overview)
33. Installing, Booting, Halting, Uninstalling and Cloning lx Branded Zones (Tasks)
34. Logging In to lx Branded Zones (Tasks)
35. Moving and Migrating lx Branded Zones (Tasks)
36. Administering and Running Applications in lx Branded Zones (Tasks)
37. Sun xVM Hypervisor System Requirements
38. Booting and Running the Sun xVM Hypervisor
40. Using virt-install to Install a Domain
Performance Tool
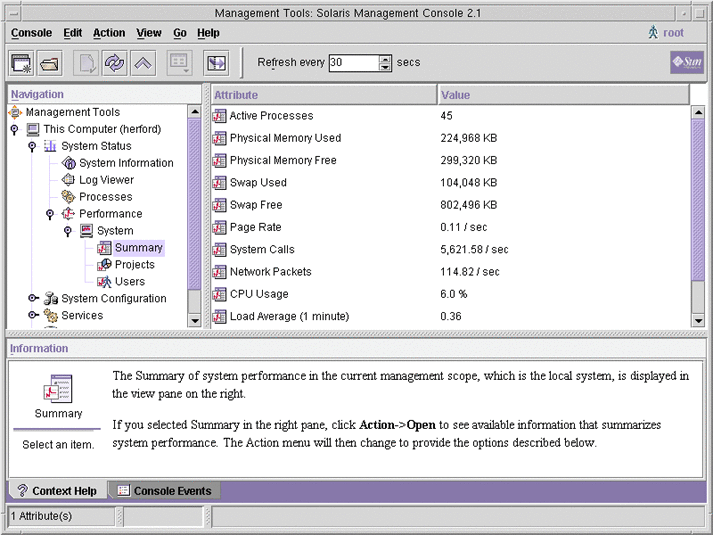
The Performance tool is used to monitor resource utilization. Resource utilization can be summarized for the system, viewed by project, or viewed for an individual user.
Figure 15-1 Performance Tool in the Solaris Management Console

How to Access the Performance Tool
The Performance tool is located under System Status in the Navigation pane. To access the Performance tool, do the following:
- Click the System Status control entity in the Navigation pane.
The control entity is used to expand menu items in the Navigation pane.
- Click the Performance control entity.
- Click the System control entity.
- Double-click Summary, Projects, or Users.
Your choice depends on the usage you want to monitor.
Monitoring by System
Values are shown for the following attributes.
Attribute |
Description |
|---|---|
Active Processes |
Number of processes that are active on the system |
Physical Memory Used |
Amount of system memory that is in use |
Physical Memory Free |
Amount of system memory that is available |
Swap Used |
Amount of system swap space that is in use |
Swap Free |
Amount of free system swap space |
Page Rate |
Rate of system paging activity |
System Calls |
Number of system calls per second |
Network Packets |
Number of network packets that are transmitted per second |
CPU Usage |
Percentage of CPU that is currently in use |
Load Average |
Number of processes in the system run queue which are averaged over the last 1, 5, and 15 minutes |
Monitoring by Project or User Name
Values are shown for the following attributes.
Attribute |
Short Name |
Description |
|---|---|---|
Input Blocks |
inblk |
Number of blocks read |
Blocks Written |
oublk |
Number of blocks written |
Chars Read/Written |
ioch |
Number of characters read and written |
Data Page Fault Sleep Time |
dftime |
Amount of time spent processing data page faults |
Involuntary Context Switches |
ictx |
Number of involuntary context switches |
System Mode Time |
stime |
Amount of time spent in the kernel mode |
Major Page Faults |
majfl |
Number of major page faults |
Messages Received |
mrcv |
Number of messages received |
Messages Sent |
msend |
Number of messages sent |
Minor Page Faults |
minf |
Number of minor page faults |
Num Processes |
nprocs |
Number of processes owned by the user or the project |
Num LWPs |
count |
Number of lightweight processes |
Other Sleep Time |
slptime |
Sleep time other than tftime, dftime, kftime, and ltime |
CPU Time |
pctcpu |
Percentage of recent CPU time used by the process, the user, or the project |
Memory Used |
pctmem |
Percentage of system memory used by the process, the user, or the project |
Heap Size |
brksize |
Amount of memory allocated for the process data segment |
Resident Set Size |
rsssize |
Current amount of memory claimed by the process |
Process Image Size |
size |
Size of the process image in Kbytes |
Signals Received |
sigs |
Number of signals received |
Stopped Time |
stoptime |
Amount of time spent in the stopped state |
Swap Operations |
swaps |
Number of swap operations in progress |
System Calls Made |
sysc |
Number of system calls made over the last time interval |
System Page Fault Sleep Time |
kftime |
Amount of time spent processing page faults |
System Trap Time |
ttime |
Amount of time spent processing system traps |
Text Page Fault Sleep Time |
tftime |
Amount of time spent processing text page faults |
User Lock Wait Sleep Time |
ltime |
Amount of time spent waiting for user locks |
User Mode Time |
utime |
Amount of time spent in the user mode |
User and System Mode Time |
time |
The cumulative CPU execution time |
Voluntary Context Switches |
vctx |
Number of voluntary context switches |
Wait CPU Time |
wtime |
Amount of time spent waiting for CPU (latency) |
| Previous | Next |